Understanding the Jenkins UI
When you land on the dashboard after setup, here is what you are looking at:
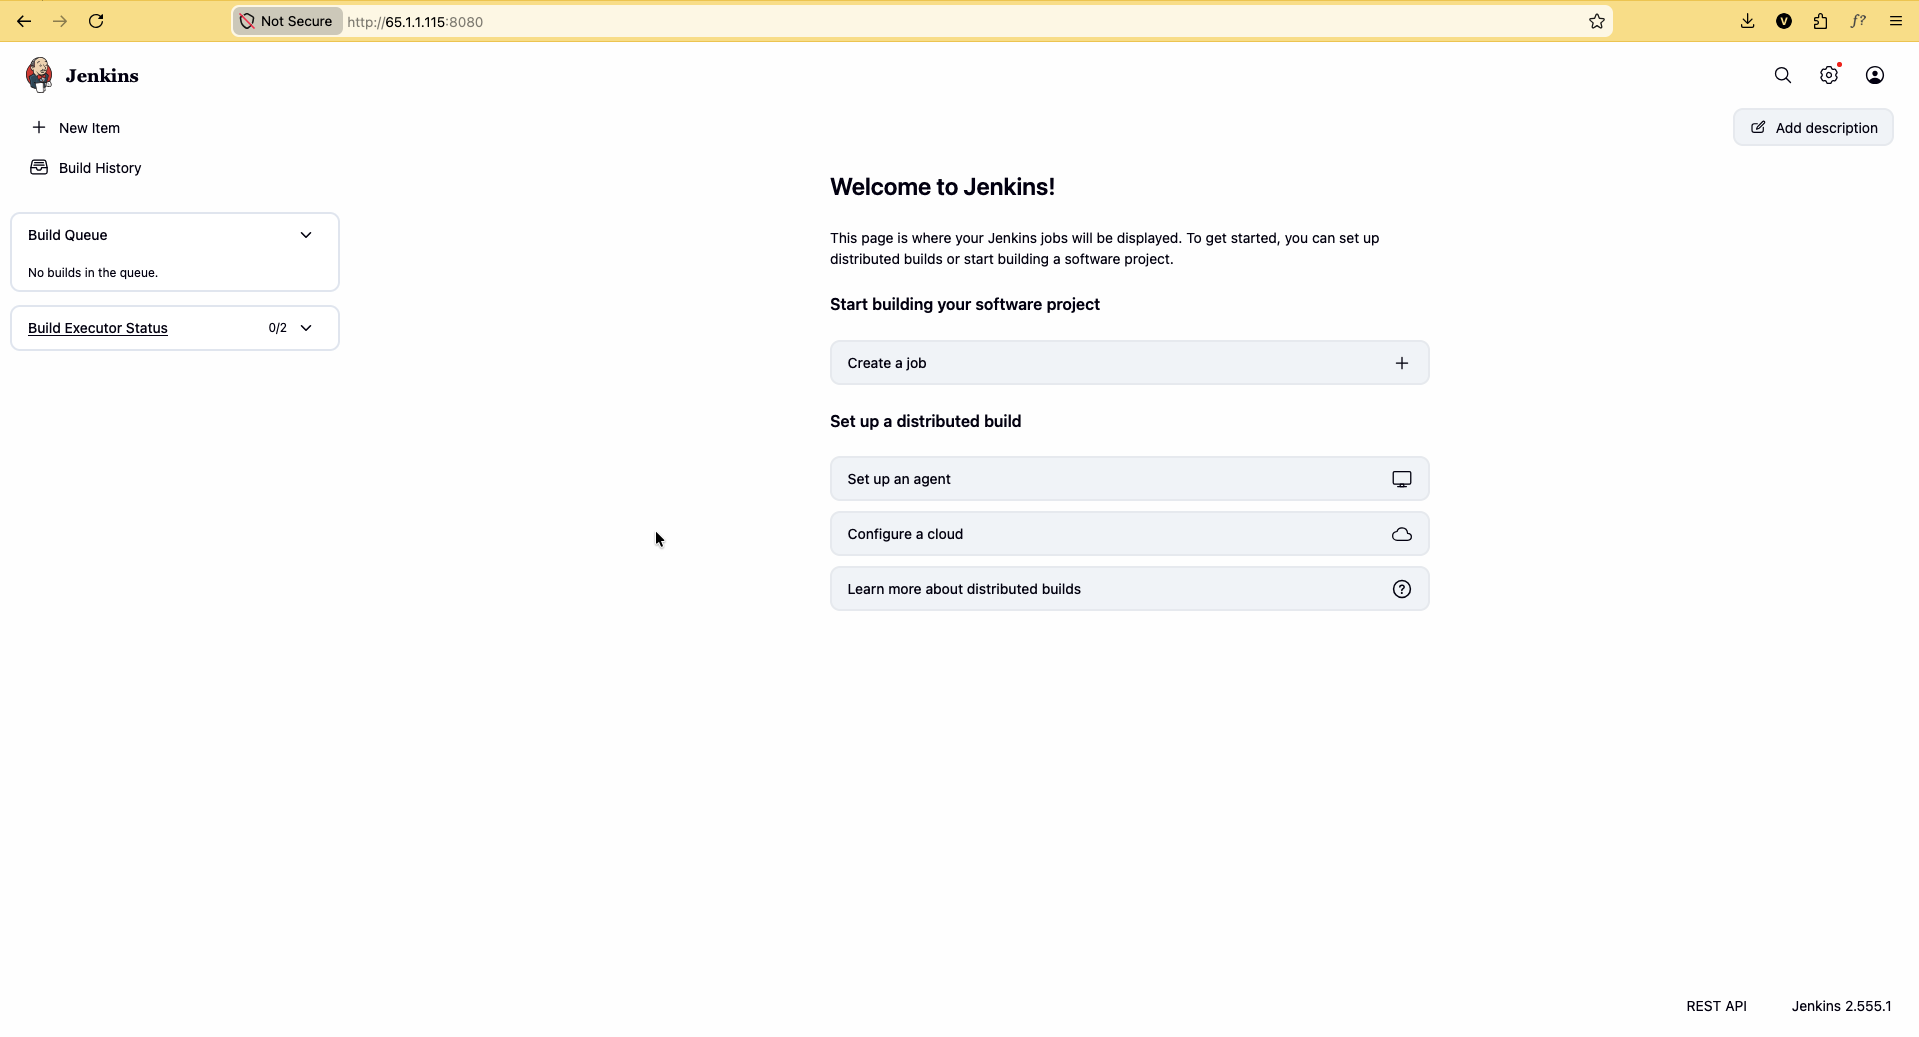
| Element | Purpose |
|---|---|
| New Item | Create a new job (Freestyle, Pipeline, Multibranch, Folder, …) |
| Build Queue | Jobs waiting to run |
| Build Executor Status | Jobs currently running on executors |
| Manage Jenkins | Global settings, plugins, credentials, nodes |
| Build History | Recent builds across jobs (also per-job on the left) |
New Item
Every job type starts here. On Day 1 you use Freestyle project. Later days add Pipeline and Multibranch Pipeline.
Build Queue & executors
- If all executors are busy, new builds sit in the Build Queue
- By default the built-in node has a small number of executors — the controller runs builds until you add agents (Day 4)
Manage Jenkins
Open this for:
- Plugins — install GitHub, Email Extension, Docker Pipeline, etc.
- Credentials — store GitHub PATs, Docker Hub passwords, SSH keys
- Nodes / Clouds — Master–Agent setup
- System — SMTP, Jenkins URL, global tools
Build History & Console Output
For any job:
- Click a build number (
#1,#2, …) - Open Console Output
The console is your first debugging tool. Almost every Day 1–2 failure is visible there.
Always open Console Output when a build fails before changing the job config again.
Next: create Project 1 — a Freestyle job connected to GitHub.